
User Profile
Goals
Goal Weight:
Goal Clothing Size:
My Mission Statement:
Photos
My Photos
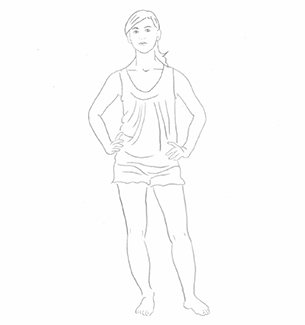
Full Body (before)
Full Body (after)
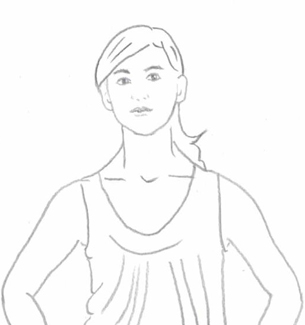
Face (before)
Face (after)
Weight and measurements
Measurement in
| Week | 1 | 2 | 3 | 4 |
|---|---|---|---|---|
| Weight | ||||
| Left arm | ||||
| Right arm | ||||
| Chest | ||||
| Waist | ||||
| Hips | ||||
| Left thigh | ||||
| Right thigh |
pH and ketones
| Week | pH | Ketone | Week | pH | Ketone |
|---|---|---|---|---|---|
| 1 | 7 | ||||
| 2 | 8 | ||||
| 3 | 9 | ||||
| 4 | 10 | ||||
| 5 | 11 | ||||
| 6 | 12 |
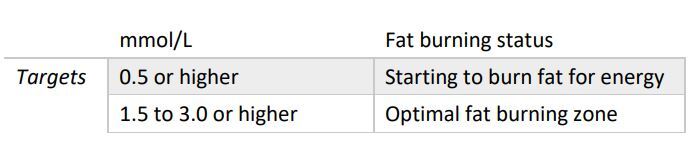
Optimal Keytones
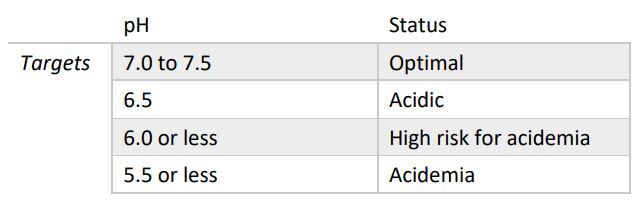
Optimal pH
Symptom score
| Week | 1 | 10 |
|---|---|---|
| Bloating | ||
| Gas | ||
| Stomach pain | ||
| Heart burn | ||
| Constipation | ||
| Diarrhea | ||
| Irritable bowel | ||
| Irritable | ||
| Excessive thirst | ||
| Bad breath | ||
| Get sick easily | ||
| Poor sleep | ||
| Dry skin | ||
| Acne | ||
| Joint pain | ||
| Muscle pain | ||
| Fatigue | ||
| Hormone issues | ||
| Percentage score | % | % |
Macros
| Height (cm): | 1 |
|---|---|
| Your ideal daily protein intake is: | 50g |
| Your ideal daily fat intake is: | 125g |
| Your ideal daily carbohydrate intake is: | 40g |
Important: Carb intake is 20g or less during the program. The carbohydrate value in the calculator is your ideal carb intake after the program (after insulin and glucose are optimal and stabilized).
Blood test result
| W1 | W12 | Unit | Optimal | Normal | |
|---|---|---|---|---|---|
| Glucose | mmol/L | 4-5.0 | 3.2-5.4 | ||
| Insulin | mU/L | 3-5 | 0-25 | ||
| Total cholesterol | mmol/L | 5.5-7.0 (adult) | 3.6-5.2 | ||
| Triglycerides | mmol/L | 0.4-1.0 | 0.5-1.8 | ||
| HDL | mmol/L | > 1.8 | 1.0-2.0 | ||
| LDL | mmol/L | 2.5-4.1 | 1.5-3.4 | ||
| Chol/HDL ratio | mmol/L | 3-4.5 | 0-4.5 | ||
| TSH | mIU/L | 1.0-2.3 | 0.5-4.0 | ||
| FT4 | pmol/L | 15-19 | 10-20 | ||
| FT3 | pmol/L | 5.0-5.5 | 3.5-6.0 | ||
| Serum iron | umol/L | > 14-17 | 5-30 | ||
| TIBC | umol/L | 53-62 | 45-72 | ||
| Trans sat | % | 28-35 | 20-55 | ||
| Ferritin | ug/L | 100-200 | 15-165 | ||
| Vitamin D | nmol/L | 125-175 | 50* | ||
| Cortisol | nmol/L | 303-496 | 110-550 |
| Description | ||
| Blood sugar | Glucose | Sugar in blood stream from carb breakdown. |
| Insulin | Hormone released to control glucose in bloodstream. High levels indicate potential insulin resistance. | |
| Lipid profile | Total cholesterol | Protective lipid response and precursor to hormones, necessary for brain and nerve function, needed to remove fat soluble toxins. Will go up in response to inflammation, injury etc. |
| Triglycerides | Produced to transport excess sugar, alcohol and fat. Initial rise is protective. Chronically elevated sign of inflammation. | |
| HDL | High density lipoprotein, carries fresh cholesterol from the liver to the cells. | |
| LDL | Low density lipoprotein, carries recycled cholesterol from the cells, back to the liver. | |
| Chol/HDL ratio | When HDL makes up 25% or more of total cholesterol, indicative of lower heart disease risk. | |
| Thyroid | TSH | Thyroid Stimulating Hormone, stimulates the production of T3 and T4. High indicates low thyroid function. Low indicates over-active thyroid. |
| Free T4 | T4 is converted to T3 when it reaches the organs and body tissue. | |
| Free T3 | Active thyroid hormone, regulates metabolism. | |
| Iron | Serum Iron | Iron in bloodstream. |
| TIBC | Co-factors to bind iron. Not enough co-factors will cause excess to build up in blood. | |
| Trans Sat | Percentage of iron in blood bound to transferrin. | |
| Ferritin | Stores iron for use. Low levels associated with anemia, fatigue, brain fog, sugar cravings, hair loss. Excess associated with chronic inflammation. | |
| Vitamin D | 25-hydroxy Vitamin D | Low associated with fatigue, hair loss, depression, poor concentration, poor skin, poor sleep, joint pain, osteoporosis, heart disease/high blood pressure, frequent illness. High associated with too much supplementation (once supplementing, regular testing is necessary). |
| Cortisol | Pl Cortisol (am) | Stress hormone. High associated with low melatonin (sleep hormone), high-stress. Low associated with adrenal fatigue, prolonged stress, Addison’s. |